Iniciaste sesión como:
filler@godaddy.com
Iniciaste sesión como:
filler@godaddy.com

Both ports report zero errors, yet 14.8% of the packets never arrive. One read-only FlowWeaver workflow finds the link, applies fixed rules and pins the verdict on the Grafana graph.
Lab: three Nokia SR Linux nodes in containerlab, with packet loss injected on purpose. No production or customer data.

Packets are being lost between two devices, but every error counter on both ports reads zero, so each device looks healthy on its own.
NetBox knows what is connected to what. Prometheus knows what each end sent and received. Grafana is where the operator is looking. Cross-checking them by hand, one interface at a time, is where the time goes.
Three Nokia SR Linux nodes in containerlab, in a triangle, with live UDP traffic. The fault: packet loss injected on srl1 ethernet-1/1, toward srl2, with containerlab netem.
gNMIc collects the interface counters into Prometheus, and Grafana shows them.
NetBox with the devices, their interfaces and the cables between them.
Self-hosted, with its NetBox integration, a Grafana MCP server and an email channel.
"Create a workflow called "Silent packet loss check" that diagnoses traffic lost between two devices when both ports look healthy. Inputs: device and interface, default srl1 and ethernet-1/1. 1. Ask NetBox which device and interface are on the other end of the cable. 2. Using the Grafana MCP query_prometheus tool on the prometheus datasource, get for both ends the last 5 minutes of packets sent and received in both directions, plus port errors: FCS errors, input discards, output errors and output discards (do not use in_error_packets). 3. Compare both ends and give one verdict from fixed rules: silent loss in one direction (8 percent or more with clean ports), errors on one end, errors on both ends, healthy link, cable missing in NetBox, telemetry missing, not enough traffic, and an inconclusive fallback. 4. Create a Grafana annotation with the verdict on the dashboard silent-loss, panel 1, at the time of the check. 5. Email the verdict with the figures to [our ops mailbox]. If any step fails, send a failure email. The workflow must not change anything on the network. Create it in draft."
It took a few follow-up messages to get the plan right. FlowWeaver answered with a plan and built nothing until it was confirmed. The result: a draft of 12 nodes and five new read-only Python snippets, checked in simulation with 0 issues.

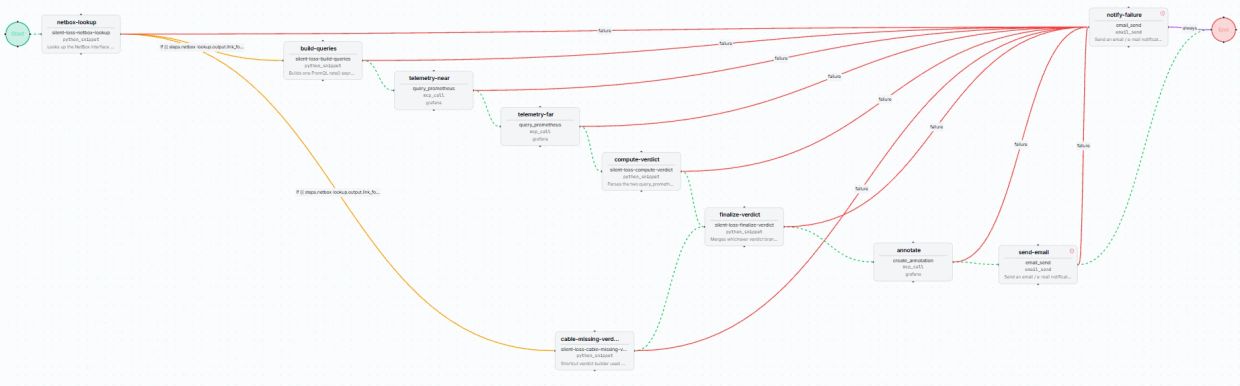
Ten steps, each one visible on the canvas. The far end of the cable comes from NetBox, the numbers from Prometheus, and the verdict from fixed rules, not from the AI.
Reads the cable peer of the interface in NetBox. No cable: the workflow takes the "cable missing" branch instead of guessing.
Two Grafana MCP query_prometheus calls fetch six SR Linux counters per end, raw, over the last 5 minutes.
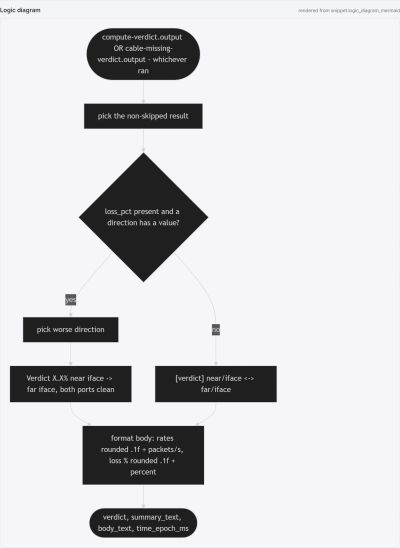
Turns counters into packets per second and returns exactly one verdict, with every figure behind it.
Writes the annotation text and places it on the sent vs received panel, at the moment of the diagnosis.
Emails the verdict and figures. If any step fails, a separate email names the step and links to the run.

FlowWeaver shows the logic of each node as a diagram, so the rules can be checked without reading code. They run in this order.
No samples at all is "telemetry missing". Less than 1 packet/s sent in both directions is "not enough traffic".
Errors or discards on a port. The problem is visible on the ports, so it is not silent.
Both ports clean and 8% or more of what one end sent never reached the other. The 8% threshold leaves room for sampling noise: in the lab, timing alone shows 2-5% of difference between the two ends.
Both ports clean and the loss stays below 8%.
A separate branch, cable-missing-verdict, says so with the reason, and the result still reaches Grafana and the mailbox.
The workflow never opens SSH and never changes a configuration. It reads NetBox and Prometheus.
The annotation is the only change it makes, plus the email.
It exposes search, datasource reads, Prometheus queries and annotations. Datasource creation and changes are blocked at the MCP proxy.
Grafana OSS has no annotation-only role, so the service account behind the MCP server is an Editor. The limit comes from which tools the MCP server exposes, not from the Grafana role.

The whole graph is checked before it can run. Simulation does not test live reachability, and it says so.
Promoted from draft to QA and run there, against the devices that allow QA.
Production needs a passing QA run from the last 48 hours and an approver's name, different from the person promoting.
The AI built the workflow. The engine runs it. No LLM decides anything at run time.

The Production run completed all 12 steps in 8.7 seconds: "srl1/ethernet-1/1 -> srl2/ethernet-1/1 is losing 14.8% of packets with both ports reporting clean counters."
srl1 sent 371.3 packets/s and srl2 received 316.3. The other direction showed no loss.
FCS errors, discards and output errors stayed at zero. The verdict was pinned on the Grafana panel and emailed with the figures.
The same loss, computed directly in Prometheus, reads 14.8% at the time of the run.
It tells you which link and which direction, not what sits in the middle of the link (a patch panel, a media converter or a carrier circuit). It is built for a point-to-point link with a cable in NetBox.

Run 64d1de93 completed its 12 steps in 8.7 s, each one logged with its timing. The failure branches were skipped.

The verdict lands as an annotation on the Grafana panel at 16:39:56: 14.8% lost from srl1 to srl2, both ports clean.

The loss queried on its own in Grafana Explore holds near 15% and reads 14.8 at the time of the run.
FlowWeaver is open source (Apache 2.0) and self-hosted, with your own LLM.
Install it and follow the Quick Start at github.com/Isaza-Labs/flow-weaver.
NetBox with your cables, Prometheus with interface counters, and a Grafana MCP server.
If you have telemetry and NetBox, request a demo and we'll build this check on your stack.
Copyright © 2026 NetworkingDev - All Rights Reserved.
Nashira and FlowWeaver are products of Isaza Labs LLC.